

SERVICE · DATA
IoT and Big Data
From the sensor to the dashboard, through everything in between.
Ingestion, processing, storage, analytics and exploitation: the full data lifecycle.
IndustryPublic administration
We take you to cinfo's contact form with this item already filled in, so you don't have to explain what it is about.
THE CHALLENGE
There are sensors and there is data, but no decisions
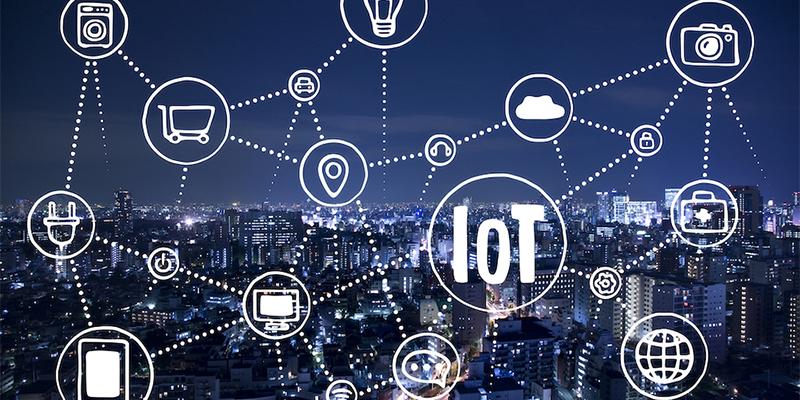
Organisations accumulate data sources that never talk to each other: deployed sensors, management systems, files and external APIs nobody has managed to integrate.
-
Data that never crosses over
Each system with its own store, format and report: nobody sees the whole.
-
Underused sensors
Installed devices generating readings nobody analyses or turns into alerts.
-
Reports that arrive late
Dashboards built by hand, already out of date by the time they are presented.
WHAT IT IS
Projects that cover the whole data lifecycle
cinfo designs and deploys complete data architectures: end-to-end consulting and integration, infrastructure sensing, real-time monitoring and predictive analytics with machine learning.
Smart facilities: presence, consumption, temperature and environmental variables, non-intrusively.
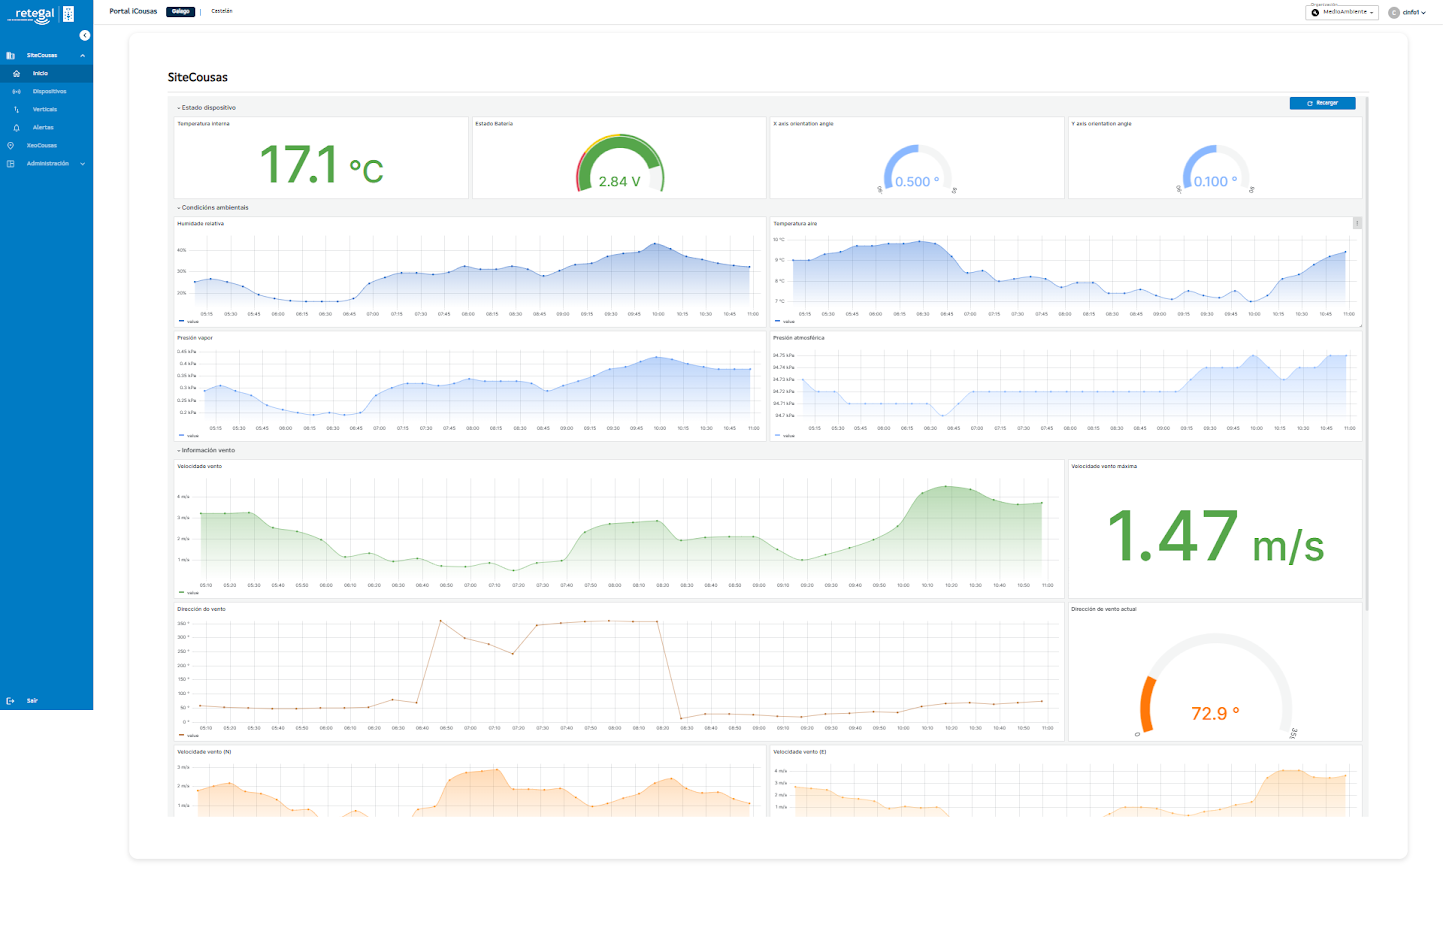
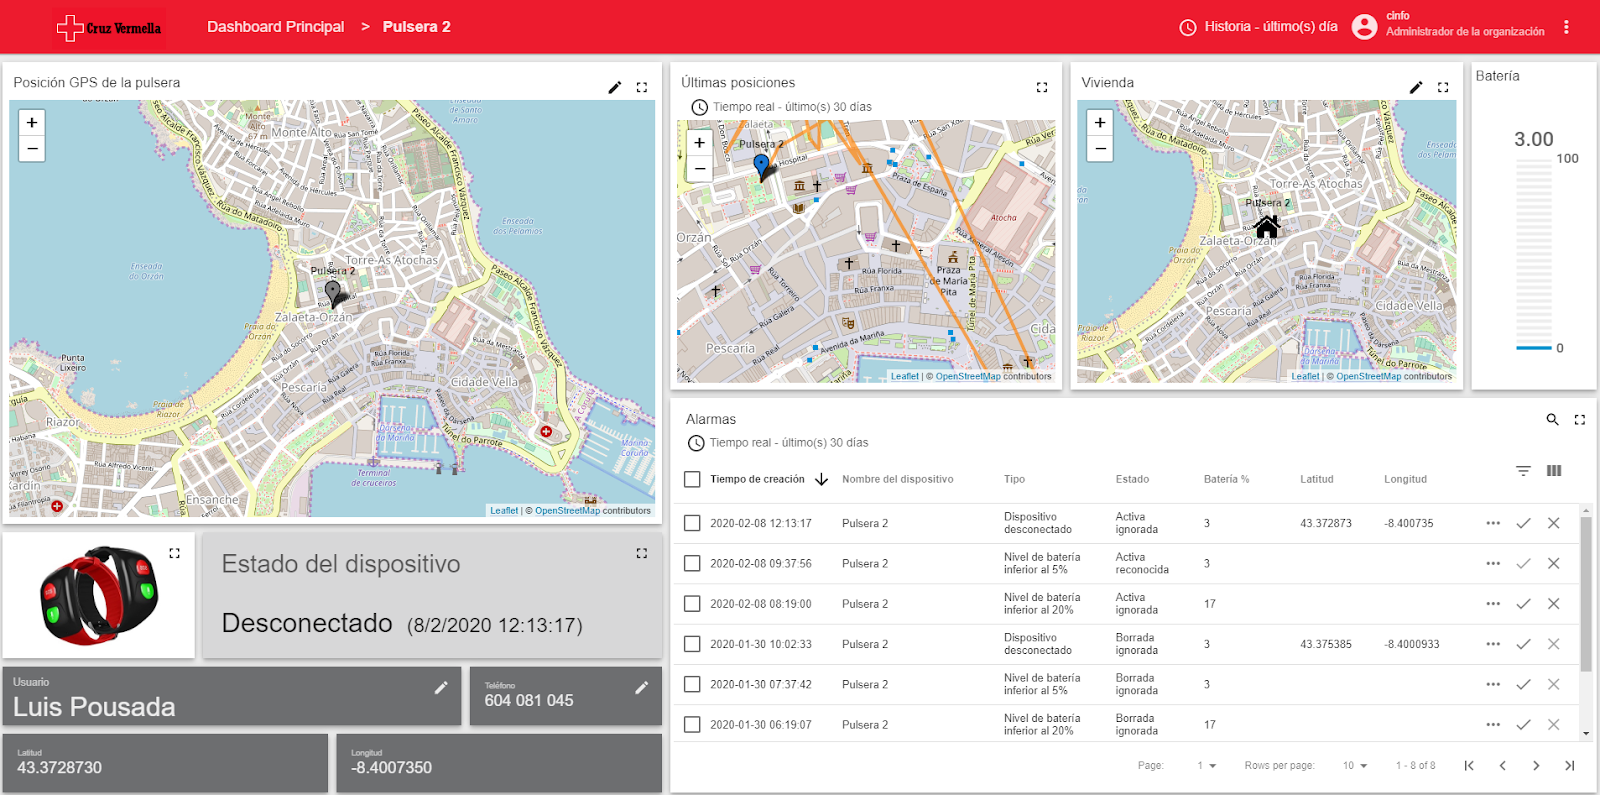
Real-time monitoring with charts, alarms and threshold definition.
Big Data: integration of heterogeneous sources for advanced analysis.
Predictive algorithms for anomaly detection and future behaviour modelling.
METHODOLOGY
Four phases, from diagnosis to production
cinfo applies a four-phase methodology proven across public sector, industrial and private projects.
-
Definition
Joint work with the business areas to set the data strategy.
-
Analysis and design
Source identification, architecture design and platform sizing.
-
Deployment
Platform installation and configuration, with sensors where relevant.
-
Projects
Development and rollout of the defined use cases on the platform.
CAPABILITIES
Specialists in the data ecosystem's tooling
-
IoT platforms
Thingsboard and FIWARE for device management, telemetry and rules.
-
Real-time ingestion
Kafka and fast queues for continuous data streams from thousands of devices.
-
Storage
PostgreSQL, MongoDB, cloud data lakes and scalable mass storage.
-
Large-scale processing
Spark and Python to transform and enrich large data volumes.
-
Visualisation
Superset, Power BI and Grafana for dashboards by user profile.
-
Sensors
Supply, configuration and installation of LoRa, Sigfox and Zigbee devices.
-
Alarms and thresholds
Configurable rules with automatic alerts to the designated owners.
-
Predictive models
Anomaly detection and future behaviour modelling with machine learning.
BENEFITS
Decisions based on what is happening now
-
One single view
Every source integrated into one platform and one common dashboard.
-
Anticipation
Alarms and predictive models that warn before the problem happens.
-
Optimised infrastructure
Real use of spaces, consumption and resources measured non-intrusively.
-
No lock-in
Standard ecosystem tooling, not a closed proprietary platform.
SCOPE
What a data project delivers
Scope can range from a proof of concept on one source to a full multi-tenant platform.
-
Source map
An inventory of available sources, formats, frequency and integration feasibility.
-
Data architecture
Design of ingestion, processing, storage and the exploitation layer.
-
Deployed platform
Installation, configuration and go-live of the chosen platform.
-
Installed sensors
Supply, provisioning, configuration and installation of the devices.
-
Dashboards
Visualisations per profile, with KPIs, alarms and report generation.
-
Analytical models
Anomaly detection or prediction algorithms over the integrated data.
HOW WE WORK
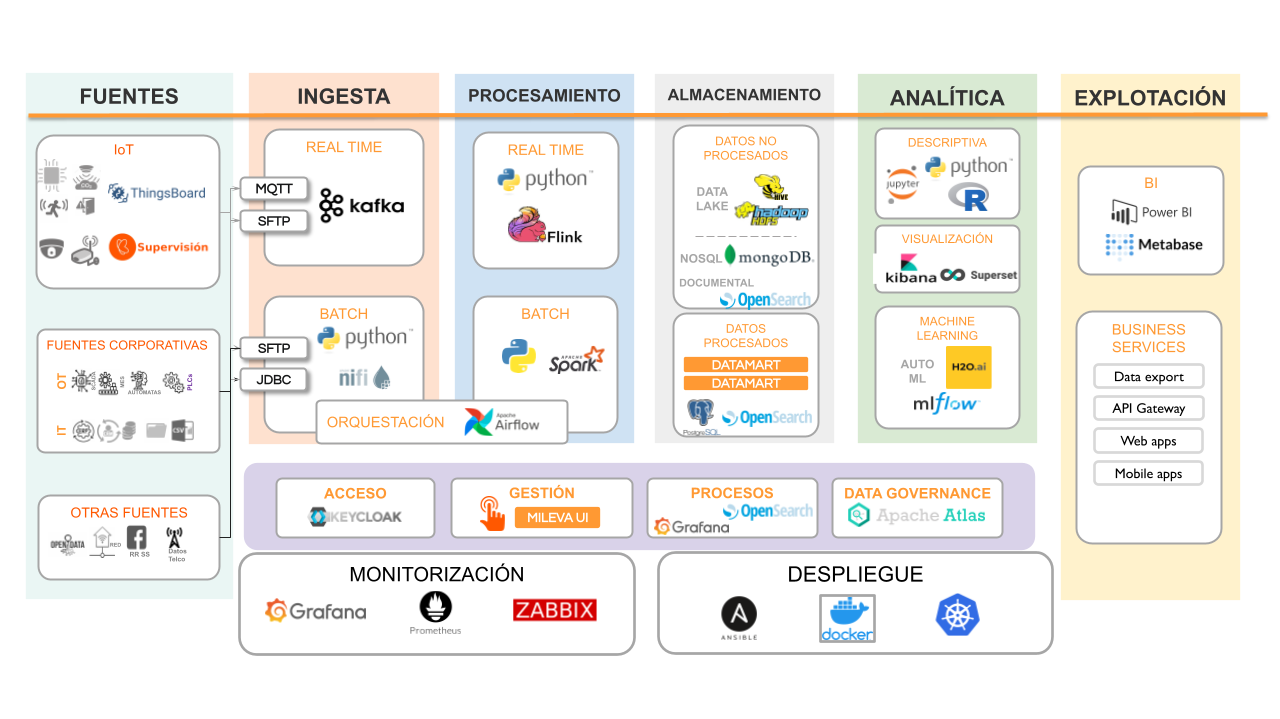
The full data lifecycle
-
Ingestion
Capture from sensors, corporate systems, files and external APIs.
-
Processing
Cleaning, normalisation and enrichment of the incoming data.
-
Analytics
Aggregations, indicators and models over the integrated dataset.
-
Exploitation
Dashboards, reports, alerts and APIs for other systems.
cinfo specialises in tools such as Thingsboard, FIWARE, Kafka, PostgreSQL, MongoDB, Python, Spark, Growthloop, Superset, Power BI and Grafana, among others.
GALLERY
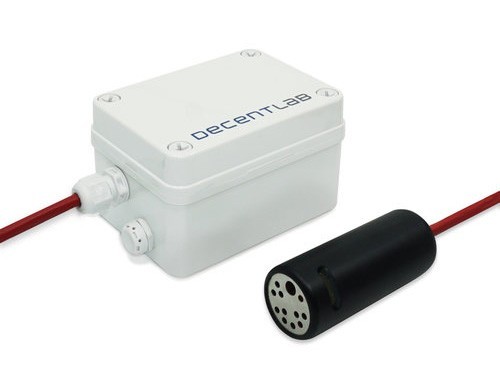
Deployed platforms and sensors
CASE STUDIES
Data in production, from vineyards to insurance
-
RTVE · CUSTOMER DATA PLATFORM
140 million new rows every day
A customer knowledge solution for RTVE Play users: collection from CRM, databases and analytics tools, deduplicated unification and audience segmentation.
-
EBROKER
A data lake for insurance brokers
Daily dumps of broker operations to an sFTP server, ingestion into a data lake, large-scale processing and dashboard visualisation.
-
ENERGYLAB · ALDEALIX
Automated management of energy communities
Ingestion from IoT sensors, MeteoGalicia, Omie, Datadis, E-Redes and Mibgas, with energy and financial dashboards, reports and real-time alarms.
CINFO IN NUMBERS
Volume handled in production
- 140 Mnew rows a day on a single project
- 1.500Zigbee devices on one platform
- 1 mindata collection interval
- 7professionals in the IoT and Big Data unit
FREQUENTLY ASKED QUESTIONS
What data leads ask
Do you supply the sensors too?
Yes. The service covers supply, provisioning, configuration, installation and maintenance of LoRa, Sigfox or Zigbee devices as appropriate.
Do you use a proprietary platform?
No. We work with standard ecosystem tooling: Thingsboard, FIWARE, Kafka, Spark, Superset, Power BI or Grafana, whichever suits the project.
Can you integrate external sources?
Yes. In production projects we integrate public APIs from energy markets, weather services, grid operators and official bulletins.
How long does a proof of concept take?
It depends on the sources, but the methodology is built to reach a deployment phase with real data and a usable dashboard quickly.
Who owns the data?
The client. cinfo deploys and operates the platform, but the data and its exploitation belong to the organisation that generates it.
Do you build predictive models?
Yes. We develop advanced algorithms for anomaly detection and future behaviour modelling over the already integrated data.
WHO IT IS FOR
Who needs a data platform
-
Public administrations
Territorial sensor networks, environmental quality and infrastructure monitoring.
-
Industry and energy
Remote facility management, energy consumption and predictive maintenance.
-
Retail and services
Integration of sales, stock and people counting in real time.
-
Media and platforms
Audience data platforms and user segmentation.
Related items
- Services · Consulting and projects
Consulting for public administrations
From the strategic plan to project delivery, funding and tender documents included.
Public administration
- Services · Data and artificial intelligence
Computer vision
We turn any camera into a sensor that understands what it sees.
Industry · Retail
- Services · Engineering and platform
Cloud GPU and AI infrastructure
AI compute capacity with your data hosted on home soil.
Industry · Services
- Services · Engineering and platform
Custom development
A software factory specialised in telco, video and artificial intelligence.
Industry · Services · Retail
LET'S TALK
Let's start with the sources you already have
We map your data sources and propose the architecture and the first use case.